Introduction
The package comes with some simple default plots for
annex objects (as returned by annex()). The
following demonstration is based on the example as shown in the article
Prepare data from XLSX, using the file
demo_UIBK.xlsx
(please read Prepare data from XLSX for
details).
library("readxl")

# Reading measurement data
raw_df <- read_excel("demo_UIBK.xlsx", sheet = "measurements")

# Read and prepare config object
config <- read_excel("demo_UIBK.xlsx", sheet = "annex_configuration")
config <- subset(config, process == TRUE) # Remove all rows process = FALSE

# Prepare annex object
library("annex")
prepared_df <- annex_prepare(raw_df, config, quiet = TRUE)
annex_df    <- annex(RH + T + CO2 ~ datetime | study + home + room,
                     data = prepared_df, tz = "Europe/Berlin")
dim(annex_df)
## [1] 43500 10
class(annex_df)## [1] "annex" "data.frame"Plotting
Once prepared, we can call the default (base R) plotting methods:
plot(annex_df)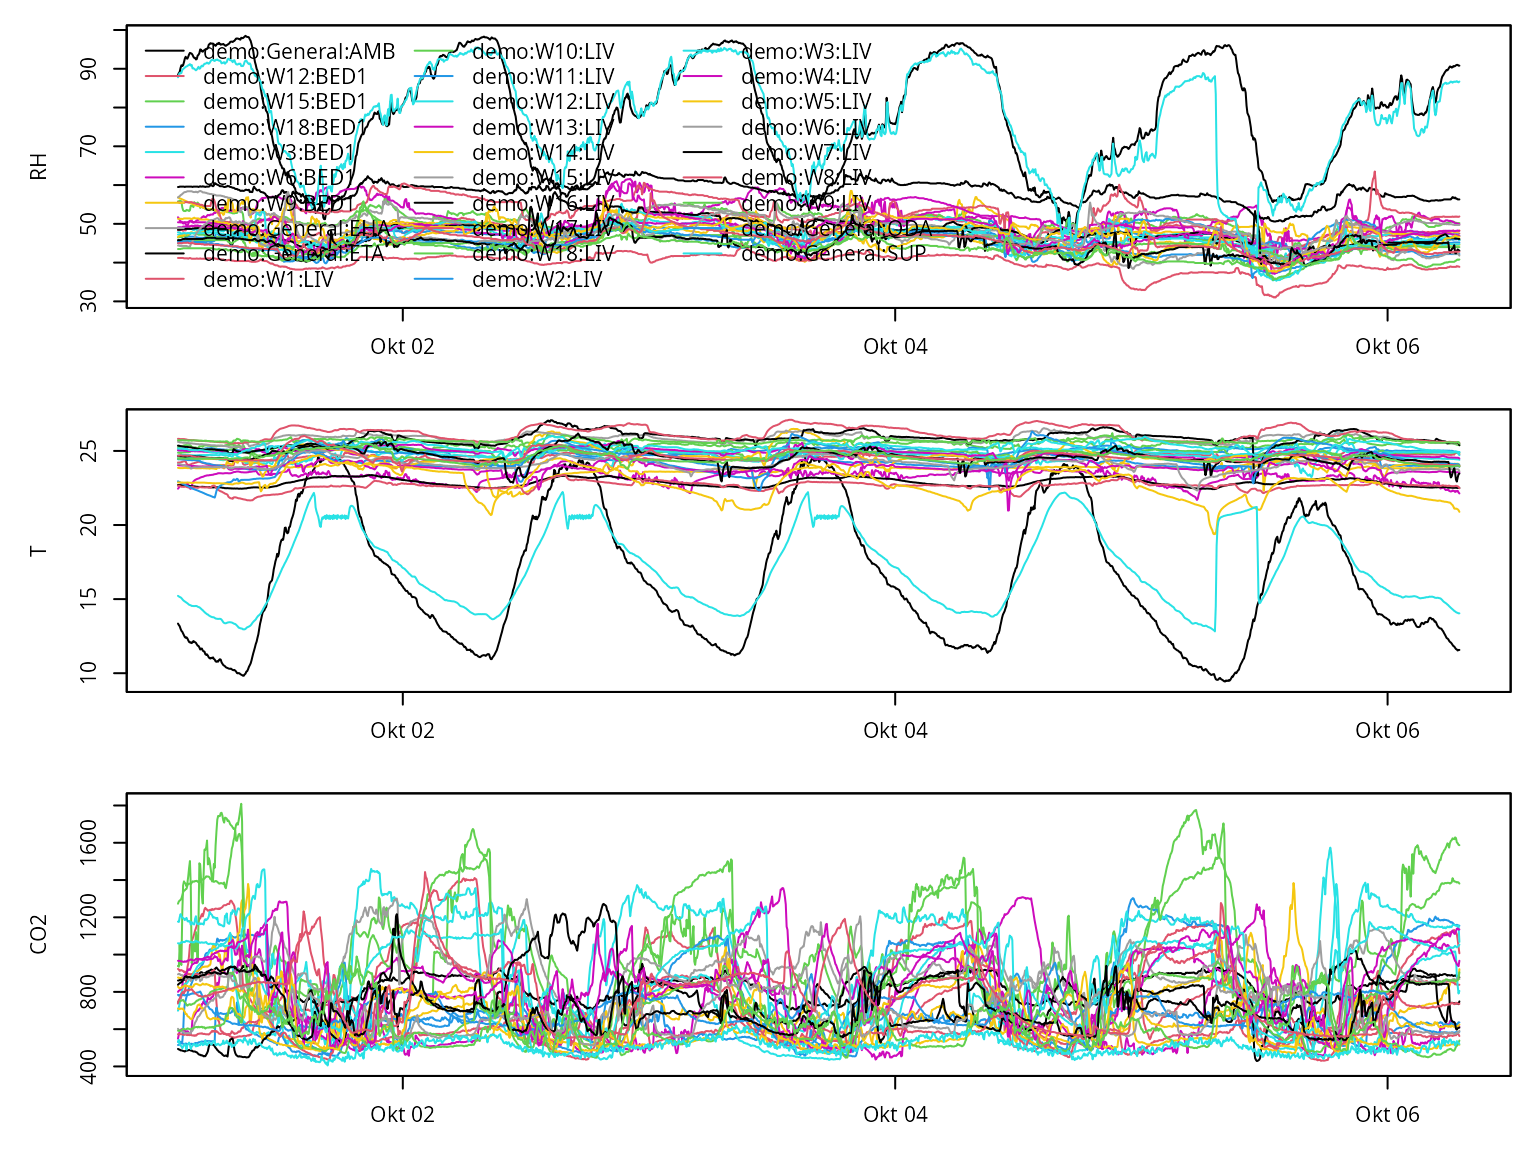
Additional arguments start and end can be
given (either objects of class POSIXt or characters in the
ISO format) to only plot a specific time period.
plot(annex_df, start = "2011-10-03", end = "2011-10-04")## Warning in .check_tzones(e1, e2): 'tzone' attributes are inconsistent
## Warning in .check_tzones(e1, e2): 'tzone' attributes are inconsistent
## Warning in .check_tzones(e1, e2): 'tzone' attributes are inconsistent
## Warning in .check_tzones(e1, e2): 'tzone' attributes are inconsistent
## Warning in .check_tzones(e1, e2): 'tzone' attributes are inconsistent
## Warning in .check_tzones(e1, e2): 'tzone' attributes are inconsistent
## Warning in .check_tzones(e1, e2): 'tzone' attributes are inconsistent
## Warning in .check_tzones(e1, e2): 'tzone' attributes are inconsistent
## Warning in .check_tzones(e1, e2): 'tzone' attributes are inconsistent
## Warning in .check_tzones(e1, e2): 'tzone' attributes are inconsistent
## Warning in .check_tzones(e1, e2): 'tzone' attributes are inconsistent
## Warning in .check_tzones(e1, e2): 'tzone' attributes are inconsistent
## Warning in .check_tzones(e1, e2): 'tzone' attributes are inconsistent
## Warning in .check_tzones(e1, e2): 'tzone' attributes are inconsistent
## Warning in .check_tzones(e1, e2): 'tzone' attributes are inconsistent
## Warning in .check_tzones(e1, e2): 'tzone' attributes are inconsistent
## Warning in .check_tzones(e1, e2): 'tzone' attributes are inconsistent
## Warning in .check_tzones(e1, e2): 'tzone' attributes are inconsistent
## Warning in .check_tzones(e1, e2): 'tzone' attributes are inconsistent
## Warning in .check_tzones(e1, e2): 'tzone' attributes are inconsistent
## Warning in .check_tzones(e1, e2): 'tzone' attributes are inconsistent
## Warning in .check_tzones(e1, e2): 'tzone' attributes are inconsistent
## Warning in .check_tzones(e1, e2): 'tzone' attributes are inconsistent
## Warning in .check_tzones(e1, e2): 'tzone' attributes are inconsistent
## Warning in .check_tzones(e1, e2): 'tzone' attributes are inconsistent
## Warning in .check_tzones(e1, e2): 'tzone' attributes are inconsistent
## Warning in .check_tzones(e1, e2): 'tzone' attributes are inconsistent
## Warning in .check_tzones(e1, e2): 'tzone' attributes are inconsistent
## Warning in .check_tzones(e1, e2): 'tzone' attributes are inconsistent
## Warning in .check_tzones(e1, e2): 'tzone' attributes are inconsistent
## Warning in .check_tzones(e1, e2): 'tzone' attributes are inconsistent
## Warning in .check_tzones(e1, e2): 'tzone' attributes are inconsistent
## Warning in .check_tzones(e1, e2): 'tzone' attributes are inconsistent
## Warning in .check_tzones(e1, e2): 'tzone' attributes are inconsistent
## Warning in .check_tzones(e1, e2): 'tzone' attributes are inconsistent
## Warning in .check_tzones(e1, e2): 'tzone' attributes are inconsistent
## Warning in .check_tzones(e1, e2): 'tzone' attributes are inconsistent
## Warning in .check_tzones(e1, e2): 'tzone' attributes are inconsistent
## Warning in .check_tzones(e1, e2): 'tzone' attributes are inconsistent
## Warning in .check_tzones(e1, e2): 'tzone' attributes are inconsistent
## Warning in .check_tzones(e1, e2): 'tzone' attributes are inconsistent
## Warning in .check_tzones(e1, e2): 'tzone' attributes are inconsistent
## Warning in .check_tzones(e1, e2): 'tzone' attributes are inconsistent
## Warning in .check_tzones(e1, e2): 'tzone' attributes are inconsistent
## Warning in .check_tzones(e1, e2): 'tzone' attributes are inconsistent
## Warning in .check_tzones(e1, e2): 'tzone' attributes are inconsistent
## Warning in .check_tzones(e1, e2): 'tzone' attributes are inconsistent
## Warning in .check_tzones(e1, e2): 'tzone' attributes are inconsistent
## Warning in .check_tzones(e1, e2): 'tzone' attributes are inconsistent
## Warning in .check_tzones(e1, e2): 'tzone' attributes are inconsistent
## Warning in .check_tzones(e1, e2): 'tzone' attributes are inconsistent
## Warning in .check_tzones(e1, e2): 'tzone' attributes are inconsistent
## Warning in .check_tzones(e1, e2): 'tzone' attributes are inconsistent
## Warning in .check_tzones(e1, e2): 'tzone' attributes are inconsistent
## Warning in .check_tzones(e1, e2): 'tzone' attributes are inconsistent
## Warning in .check_tzones(e1, e2): 'tzone' attributes are inconsistent
## Warning in .check_tzones(e1, e2): 'tzone' attributes are inconsistent
## Warning in .check_tzones(e1, e2): 'tzone' attributes are inconsistent## Warning in (function (...) : 'tzone' attributes are inconsistent## Warning in (function (...) : 'tzone' attributes are inconsistent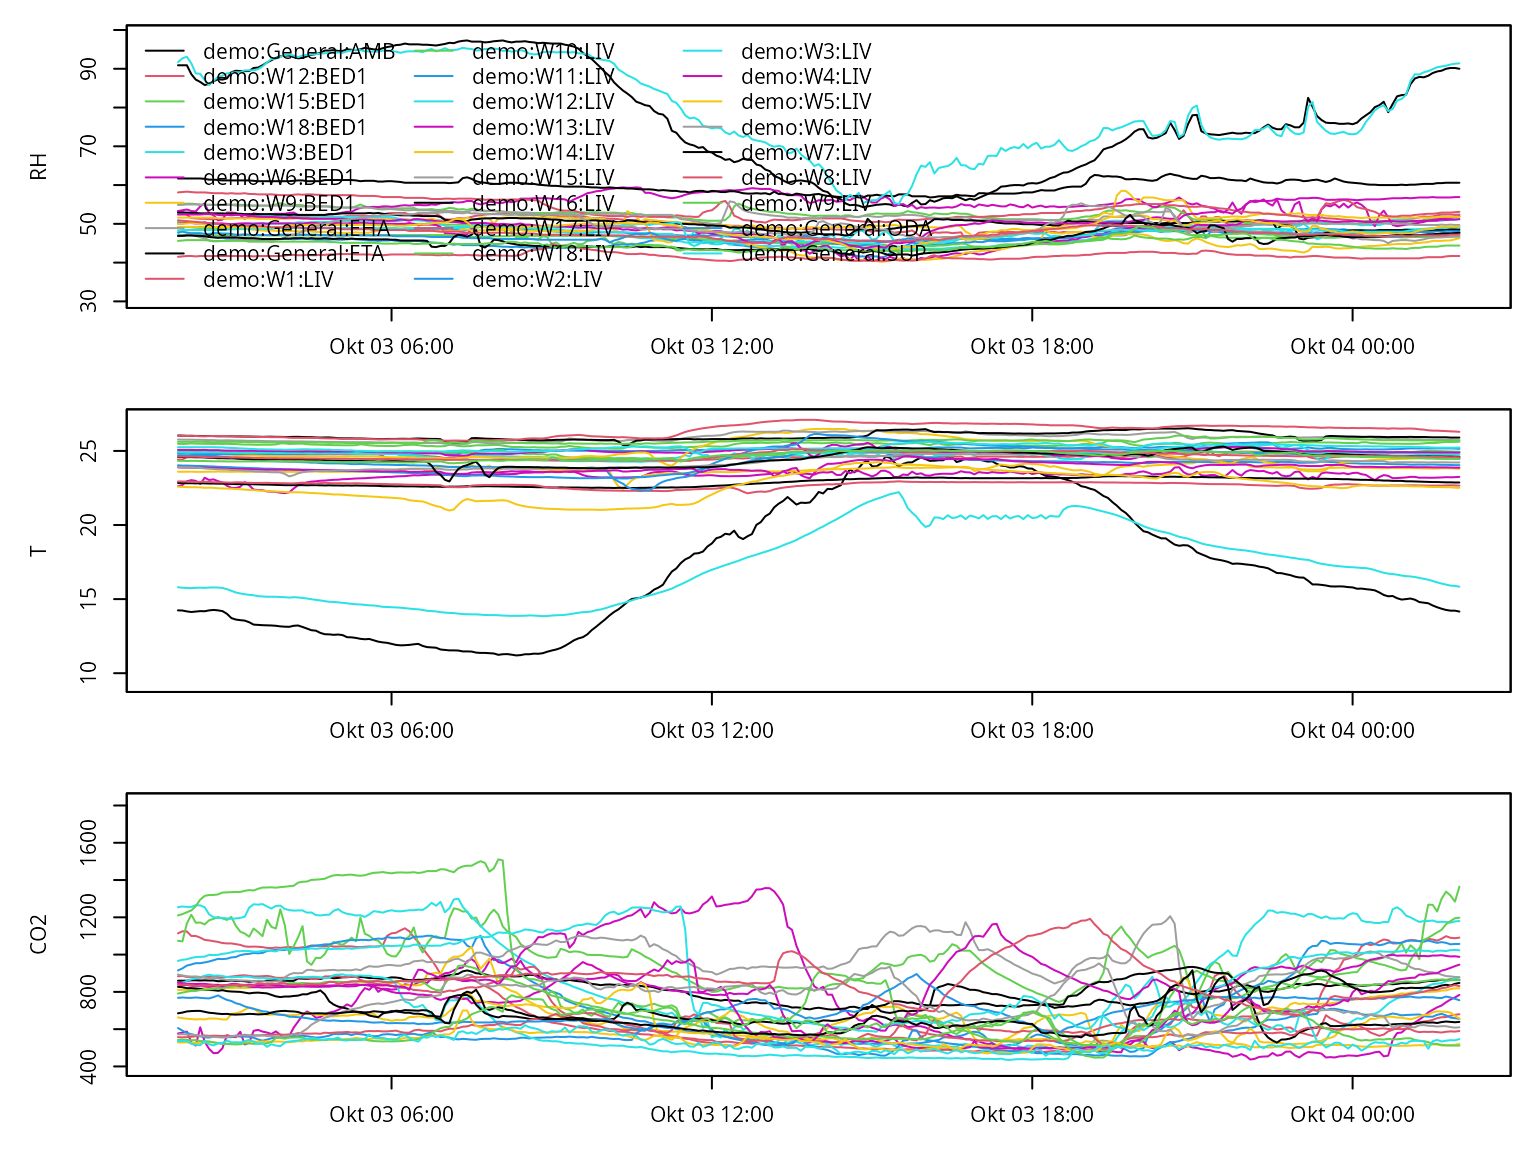
Using ggplot2
The ‘long form’ of the stats can be handy for plotting with ggplot.
stats <- annex_stats(annex_df)To ensure we have the long form, annex_stats_reshape()
can be called. If it is already in the long format it will simply return
itself, else it will be reshaped from the wide format to the desired
long format.
stats <- annex_stats_reshape(stats, format = "long")
head(stats, n = 2)
## study home room year month tod variable stats value
## 1 demo General AMB 2011 10 all RH quality_lower 0
## 2 demo General AMB 2011 10 all RH quality_upper 0Empirical CDF: The stats contains a
series of quantiles following the naming scheme
"^p[0-9\\.]+$" (e.g., p00, p02.5,
…). The code chunk below subsets the statistics to only get rows
containing these empirical quantiles, and appends an additional variable
p with the numeric value of the percentile as this is
required for the demo plot following afterwards.
# Extracting rows with empirical quantiles
tmp    <- stats[grepl("^p[0-9\\.]+$", stats$stats), ]
# Extract numeric value for plotting
tmp$p  <- as.numeric(gsub("p", "", tmp$stats))
# Unique ID as an interaction of study, home, room, month, and tod
tmp$ID <- with(tmp, interaction(study, home, room, month, tod))
library("ggplot2")
ggplot(subset(tmp, variable == "T")) +
    geom_line(aes(x = p, y = value, col = home, group = ID)) +
    facet_wrap(~ room, scale = "free") +
    ggtitle("Empirical Cumulative Distribution Function of Temperature by Room Type")
ggplot(subset(tmp, variable == "CO2")) +
    geom_line(aes(x = p, y = value, col = interaction(month, tod, sep = " - "), group = ID)) +
    facet_wrap(~ room) +
    ggtitle("Empirical Cumulative Distribution Function of CO2 Concentration by Room Type")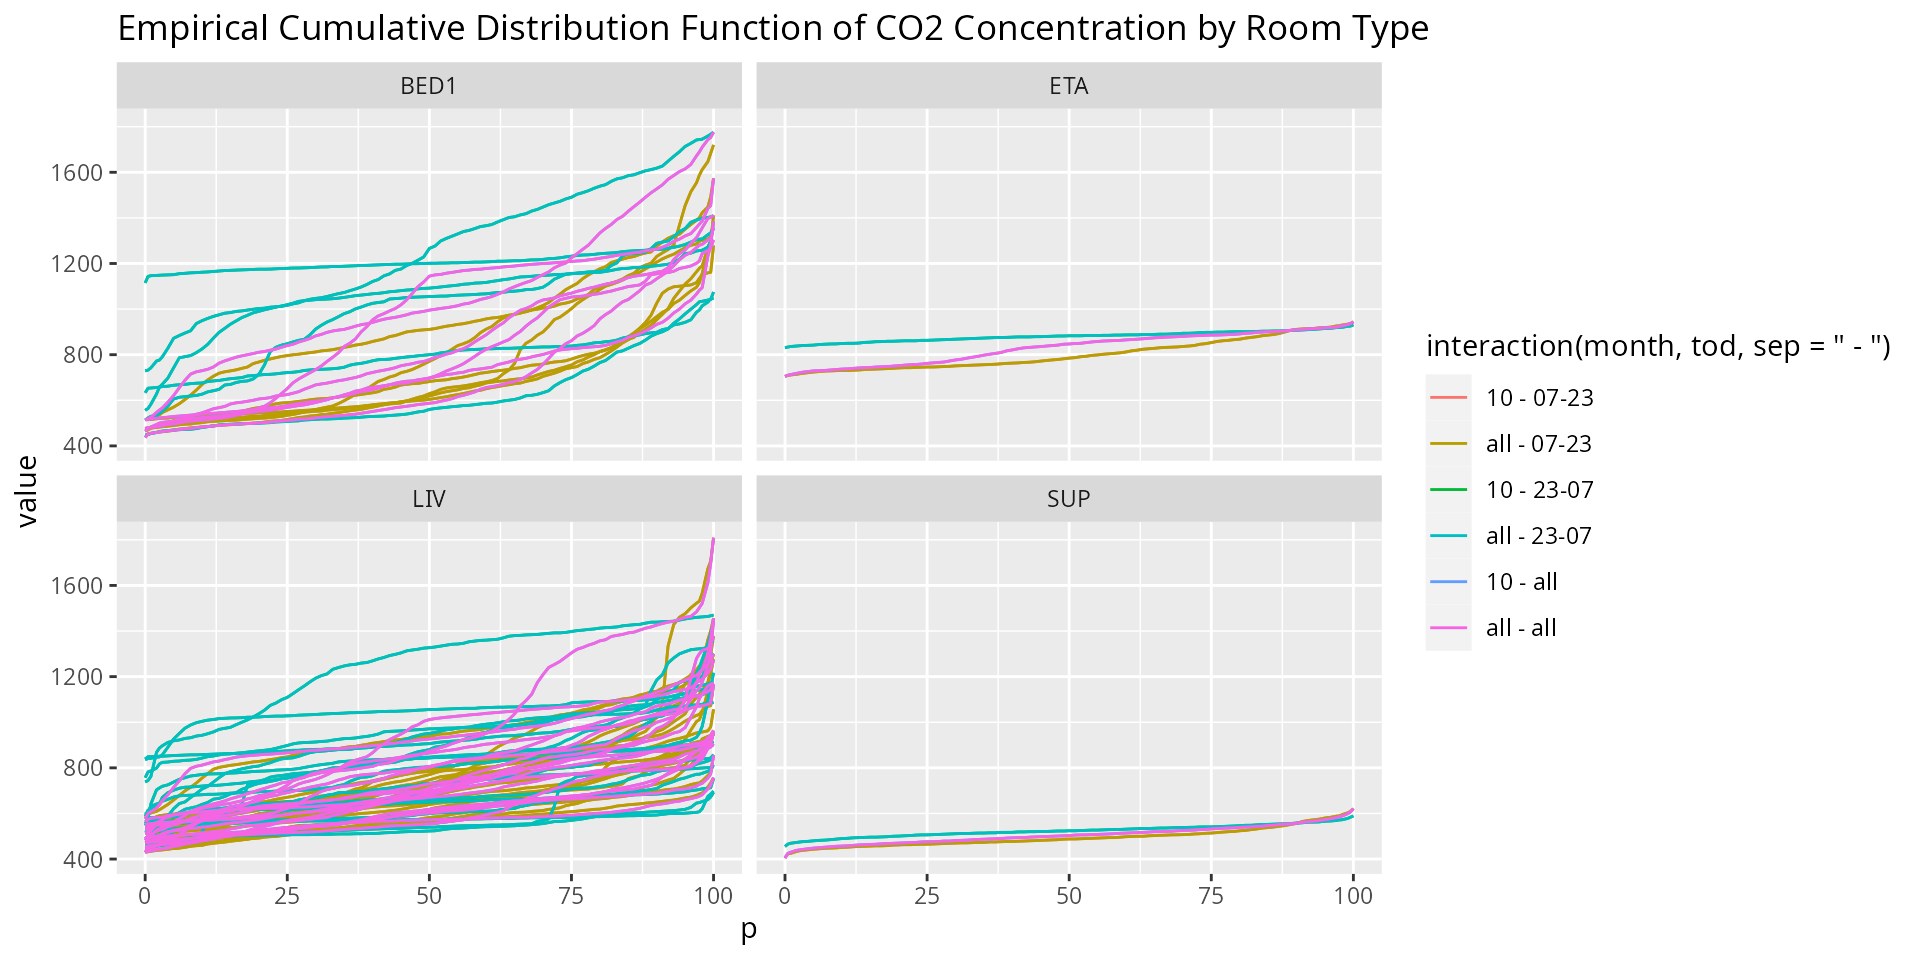
ggplot(subset(tmp, variable == "RH")) +
    geom_line(aes(x = p, y = value, col = room, group = ID)) +
    facet_wrap(~ home) +
    ggtitle("Empirical Cumulative Distribution Function of Relative Humidity by Home")